Analysis Example: Variable Rate Annuity Contract
This end-to-end example demonstrates how to define, simulate, and analyze a variable-rate Annuity (ANN) contract using the Awesome Actus Library (AAL).
0. Setup and Imports
import numpy as np
import pandas as pd
from awesome_actus_lib import ANN, ReferenceIndex, PublicActusService, LiquidityAnalysis, ValueAnalysis, IncomeAnalysis
np.random.seed(42) # for reproducability
1. Define the Contract
We define an annuity contract that pays interest and principal annually and resets its rate every 6 months based on a reference index.
ann = ANN(
    contractID="ann1",
    creatorID="me",
    counterpartyID="bank",
    notionalPrincipal=20000,
    nominalInterestRate=0.04,
    dayCountConvention="30E360",
    contractRole="RPA",
    statusDate="2024-12-31",
    initialExchangeDate="2025-01-01",
    maturityDate="2030-01-01",
    contractDealDate="2024-12-31",
    currency="USD",
    cycleOfInterestPayment="P1YL1",
    cycleOfPrincipalRedemption="P1YL1",
    cycleAnchorDateOfInterestPayment="2026-01-01",
    cycleAnchorDateOfPrincipalRedemption="2026-01-01",
    cycleOfRateReset="P6ML1",
    marketObjectCodeOfRateReset="UST5Y",
    rateSpread=0.01
)
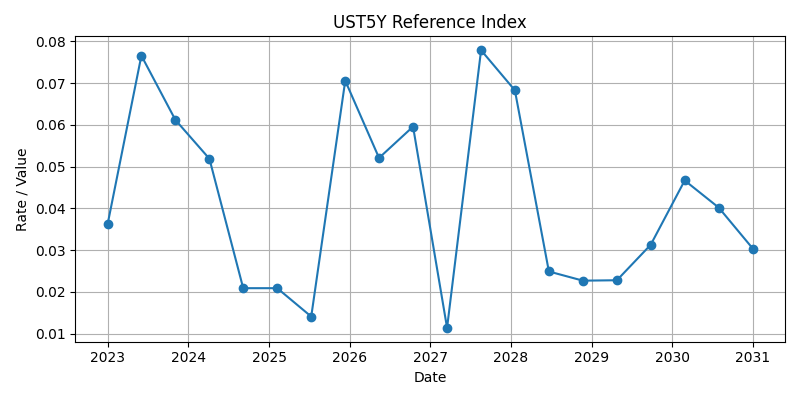
2. Simulate Reference Index (UST5Y)
We generate a synthetic interest rate index (UST5Y) with 20 semiannual points from 2023 to 2030.
index_data = pd.DataFrame({
    "date": pd.date_range(start="2023-01-01", end="2030-12-31", periods=20).strftime("%Y-%m-%d"),
    "value": np.random.uniform(0.01, 0.08, size=20).round(4)
})
ust5y = ReferenceIndex(marketObjectCode="UST5Y", source=index_data, base=1.0)
ust5y.plot()
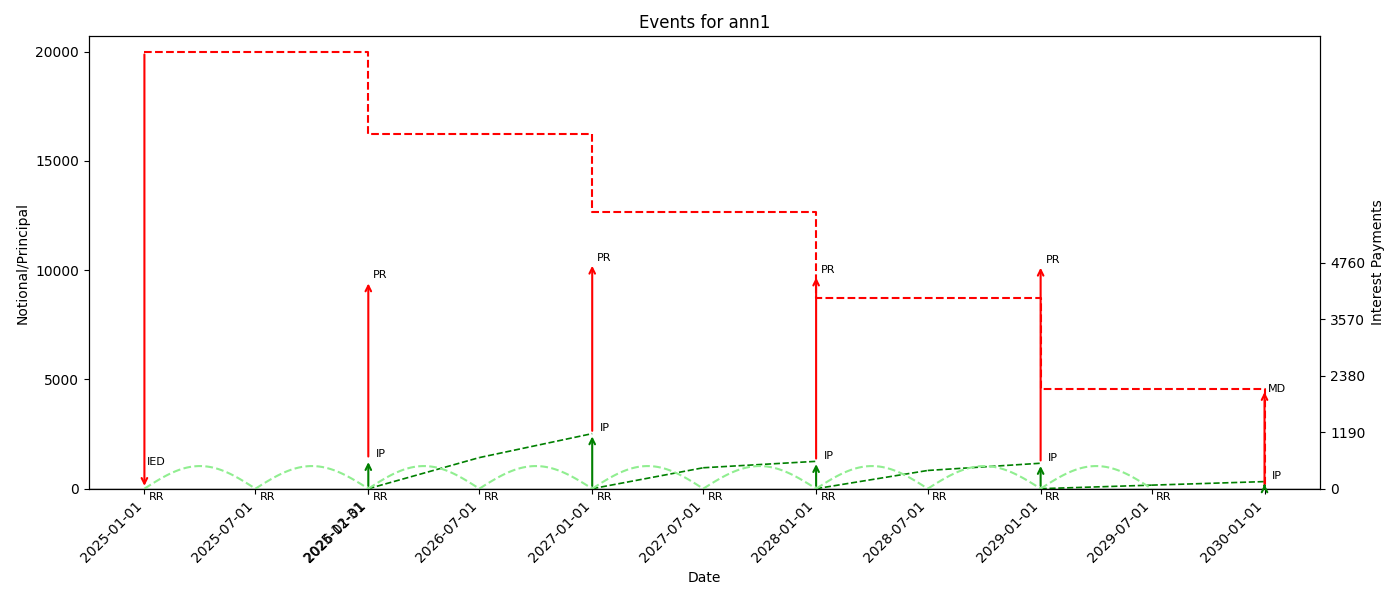
3. Generate Cash Flow Events
Using the contract and index, we generate future cash flow events (principal, interest, etc.).
service = PublicActusService()
events = service.generateEvents(portfolio=ann, riskFactors=ust5y)
events.plot()
Event Table
| type | time | payoff | currency | nominalValue | nominalRate | nominalAccrued | contractId |
|---|---|---|---|---|---|---|---|
| IED | 2025-01-01T00:00 | -20000 | USD | 20000 | 0.04 | 0 | ann1 |
| RR | 2025-01-01T00:00 | 0 | USD | 20000 | 0.0309 | 0 | ann1 |
| PRF | 2025-01-01T00:00 | 0 | USD | 20000 | 0.0309 | 0 | ann1 |
| RR | 2025-07-01T00:00 | 0 | USD | 20000 | 0.0309 | 309 | ann1 |
| PRF | 2025-07-01T00:00 | 0 | USD | 20000 | 0.0309 | 309 | ann1 |
| PRF | 2025-12-31T00:00 | 0 | USD | 20000 | 0.0309 | 616.283 | ann1 |
| PR | 2026-01-01T00:00 | 3760.32 | USD | 16239.7 | 0.0309 | 618 | ann1 |
| IP | 2026-01-01T00:00 | 618 | USD | 16239.7 | 0.0309 | 0 | ann1 |
| RR | 2026-01-01T00:00 | 0 | USD | 16239.7 | 0.0806 | 0 | ann1 |
| PRF | 2026-01-01T00:00 | 0 | USD | 16239.7 | 0.0806 | 0 | ann1 |
| RR | 2026-07-01T00:00 | 0 | USD | 16239.7 | 0.0621 | 654.459 | ann1 |
| PRF | 2026-07-01T00:00 | 0 | USD | 16239.7 | 0.0621 | 654.459 | ann1 |
| PR | 2027-01-01T00:00 | 3591.5 | USD | 12648.2 | 0.0621 | 1158.7 | ann1 |
| IP | 2027-01-01T00:00 | 1158.7 | USD | 12648.2 | 0.0621 | 0 | ann1 |
| RR | 2027-01-01T00:00 | 0 | USD | 12648.2 | 0.0696 | 0 | ann1 |
| PRF | 2027-01-01T00:00 | 0 | USD | 12648.2 | 0.0696 | 0 | ann1 |
| RR | 2027-07-01T00:00 | 0 | USD | 12648.2 | 0.0214 | 440.157 | ann1 |
| PRF | 2027-07-01T00:00 | 0 | USD | 12648.2 | 0.0214 | 440.157 | ann1 |
| PR | 2028-01-01T00:00 | 3926.05 | USD | 8722.12 | 0.0214 | 575.492 | ann1 |
| IP | 2028-01-01T00:00 | 575.492 | USD | 8722.12 | 0.0214 | 0 | ann1 |
| RR | 2028-01-01T00:00 | 0 | USD | 8722.12 | 0.0879 | 0 | ann1 |
| PRF | 2028-01-01T00:00 | 0 | USD | 8722.12 | 0.0879 | 0 | ann1 |
| RR | 2028-07-01T00:00 | 0 | USD | 8722.12 | 0.0349 | 383.337 | ann1 |
| PRF | 2028-07-01T00:00 | 0 | USD | 8722.12 | 0.0349 | 383.337 | ann1 |
| PR | 2029-01-01T00:00 | 4172.68 | USD | 4549.44 | 0.0349 | 535.538 | ann1 |
| IP | 2029-01-01T00:00 | 535.538 | USD | 4549.44 | 0.0349 | 0 | ann1 |
| RR | 2029-01-01T00:00 | 0 | USD | 4549.44 | 0.0327 | 0 | ann1 |
| PRF | 2029-01-01T00:00 | 0 | USD | 4549.44 | 0.0327 | 0 | ann1 |
| RR | 2029-07-01T00:00 | 0 | USD | 4549.44 | 0.0328 | 74.3834 | ann1 |
| PRF | 2029-07-01T00:00 | 0 | USD | 4549.44 | 0.0328 | 74.3834 | ann1 |
| IP | 2030-01-01T00:00 | 148.994 | USD | 4549.44 | 0.0328 | 0 | ann1 |
| MD | 2030-01-01T00:00 | 4549.44 | USD | 0 | 0.0328 | 0 | ann1 |
4. Liquidity Analysis
Yearly net cash flows are analyzed to identify funding needs or surpluses.
liq = LiquidityAnalysis(cf_stream=events, freq="Y")
liq.plot()
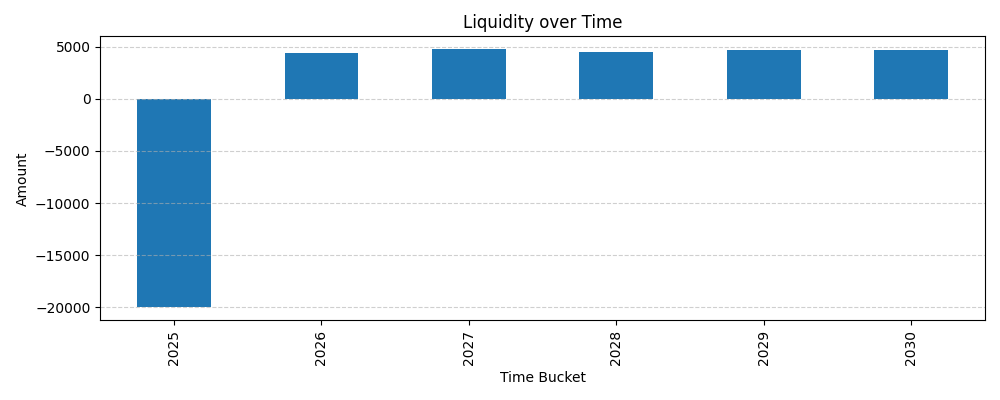
      netLiquidity
time
2025 -20000.000000
2026   4378.319824
2027   4750.203489
2028   4501.546054
2029   4708.218944
2030   4698.437641
5. Value Analysis
Discounted value of future cash flows as of 2025-01-01 using a 2% flat rate.
val = ValueAnalysis(cf_stream=events, as_of_date="2025-01-01", flat_rate=0.02)
  as_of_date  nominal_value         npv
0 2025-01-01    3036.725952  296.344084
6. Income Analysis
Annual income flows based on the contract’s interest components.
inc = IncomeAnalysis(cf_stream=events, freq="Y")
inc.plot()
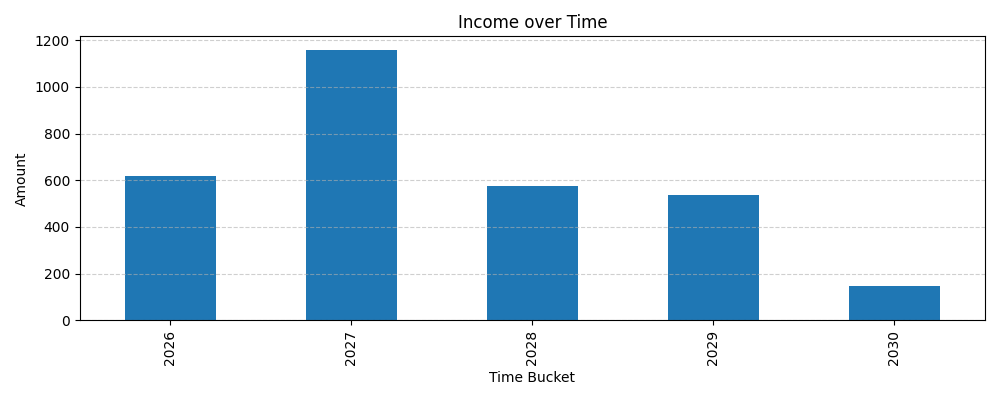
        netIncome
time
2026   618.000000
2027  1158.701181
2028   575.492093
2029   535.538408
2030   148.994270